Engineering portfolio · chief-engineer edition · director edition
Nir Herscovici
Head of Manufacturing Technology and Principal Engineer (R&D), Precision Castparts Corp. (Berkshire Hathaway), 2020–2026. Architect of the perception and control platform that runs 24/7 at eight or more aerospace-metals plants, and the engineer who wrote production code for the systems on it.
With the company 2014–2026 · M.S. and B.S. Mechanical Engineering, B.S. Computer Science, University of Nevada, Las Vegas · Co-inventor on four patent filings, one granted
- 8+plants on one reference kit: 200+ sensors, 30 GPU servers, zero production downtime
- 15+systems in 24/7 production, each with an assurance case before fielding
- 4patent filings, one granted, all in production
- 30%+less scrap and defects across the plants running these systems
- 22person R&D organization built and led for six years
- 2014Manufacturing Process Technology Engineer, R&D. Vision program started with the University of Birmingham
- 2015Research and Data Analytics Engineer, R&D
- 2016First in-house end-of-melt vision system
- 2017Senior Manufacturing Process Technology Engineer
- 2018Neural-network development begins
- 2020Head of Manufacturing Technology and Principal Engineer, R&D: a 22-person R&D organization
- 2021Provisional patent, power cutback
- 2022LMPC Best Paper Award
- 2023$500M greenfield plant breaks ground
- 2024LMPC Most Innovative Work Award
- 2025U.S. patent granted; two applications published
- 2026Weld-rating patent filed; conference paper
Part 1 · Scope
Leadership and scope
Herscovici ran manufacturing technology for melting, forging and inspection across the company's titanium plants: a 22-person R&D organization, a seven-figure budget, the company's de facto head of machine learning, and the technology standard that every site builds to. He presented roadmaps directly to the COO, won CEO approval to expand the organization, and was the company's technical face to nine jet-engine OEMs through a material-defect investigation.
Scope
Perception and control for melting, forging and inspection at 8+ plants in the U.S. and UK. 15+ systems in 24/7 production, 200+ sensors on 30 GPU servers, zero production downtime through every rollout.
People
10 engineers, 5 graduate researchers, 7 technicians. Hired four engineers directly, recruited three internally, advised all five researchers. Every engineer earned a significant promotion; one technician is now a superintendent; 85% of 15 interns became full-time engineers.
Money
Seven-figure R&D budget. Seven-figure capital requests approved on business cases with payback targets typically under 12 months. $2M+ of new OEM and cross-division funded work. Owner of the $5M+ technology package at a $500M greenfield plant.
Stakeholders
COO (roadmaps and schedules), CEO (organization expansion), OEM executives and specialists (weekly during the investigation), three engineering contractors and the furnace OEM (greenfield build), plant IT (policy standards), a DARPA consortium with four OEMs.
Title note: PCC has no chief-engineer title. "De facto chief engineer" describes the role he held at the greenfield plant, not a title.
Part 2 · Architecture and the technology roadmap
Build once, then scale across plants and repurpose across processes
Herscovici set the multi-year technology direction for machine learning, vision, sensing, inspection and automation across the company's plants and processes. The roadmap matured from isolated AI projects into a manufacturing-systems platform, and from one plant's tools into a catalog of capabilities: each one built and hardened on one process, then copied to other plants and repurposed for other processes and divisions. The model is a standard core with a local last mile: the hardware, software and data architecture are shared; mounting, thresholds, operator displays and process logic are site-specific.
The same failure modes repeated across facilities: manual supervision, fragile data integration, underestimated hardware complexity, fragmented ownership and reinvention. Each became a standardization priority: preferred hardware stacks, reusable software modules, a signal and storage architecture, documentation and acceptance-test packages, IT and security templates, and named ownership for updates and retraining, so no deployment is engineered from scratch.
Build once: what the kit has to meet
- Survive the furnace. Radiant heat, arc light, metal particulate, vibration, vacuum interfaces, and electrical noise over 100 to 300 m of cable from furnace to control room.
- Never remove the operator's live view. No single failure in analytics or storage may take it away.
- Act on the process without interrupting it. New systems connect while furnaces run and need no manual tuning; a closed loop works to a budget of 1 to 5 seconds from frame capture to PLC action.
- Fail safe. Where a result gates a step, a missing result stops the step; the operator is alarmed before any automatic action.
- Reuse at any site. One hardware, network, compute and integration standard, under IT policy agreed in advance.
- Maintainable by plant staff. No licensed black boxes, no outside specialists for routine changes.
The reference kit
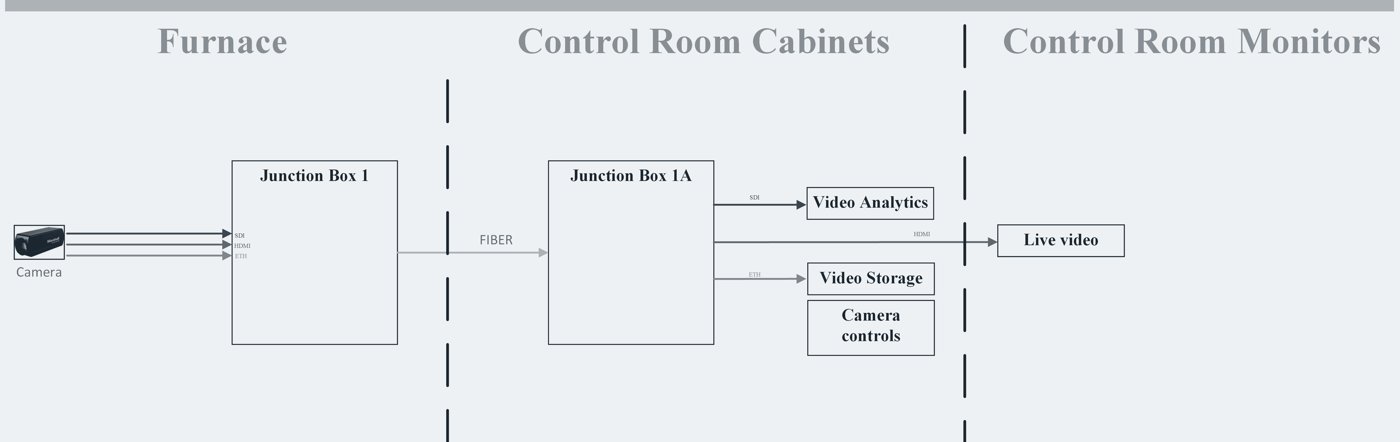
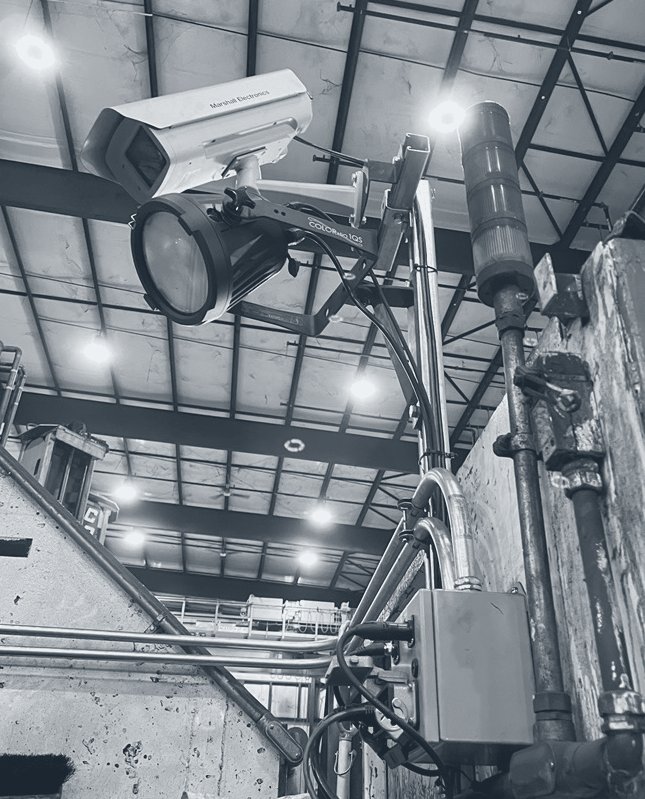
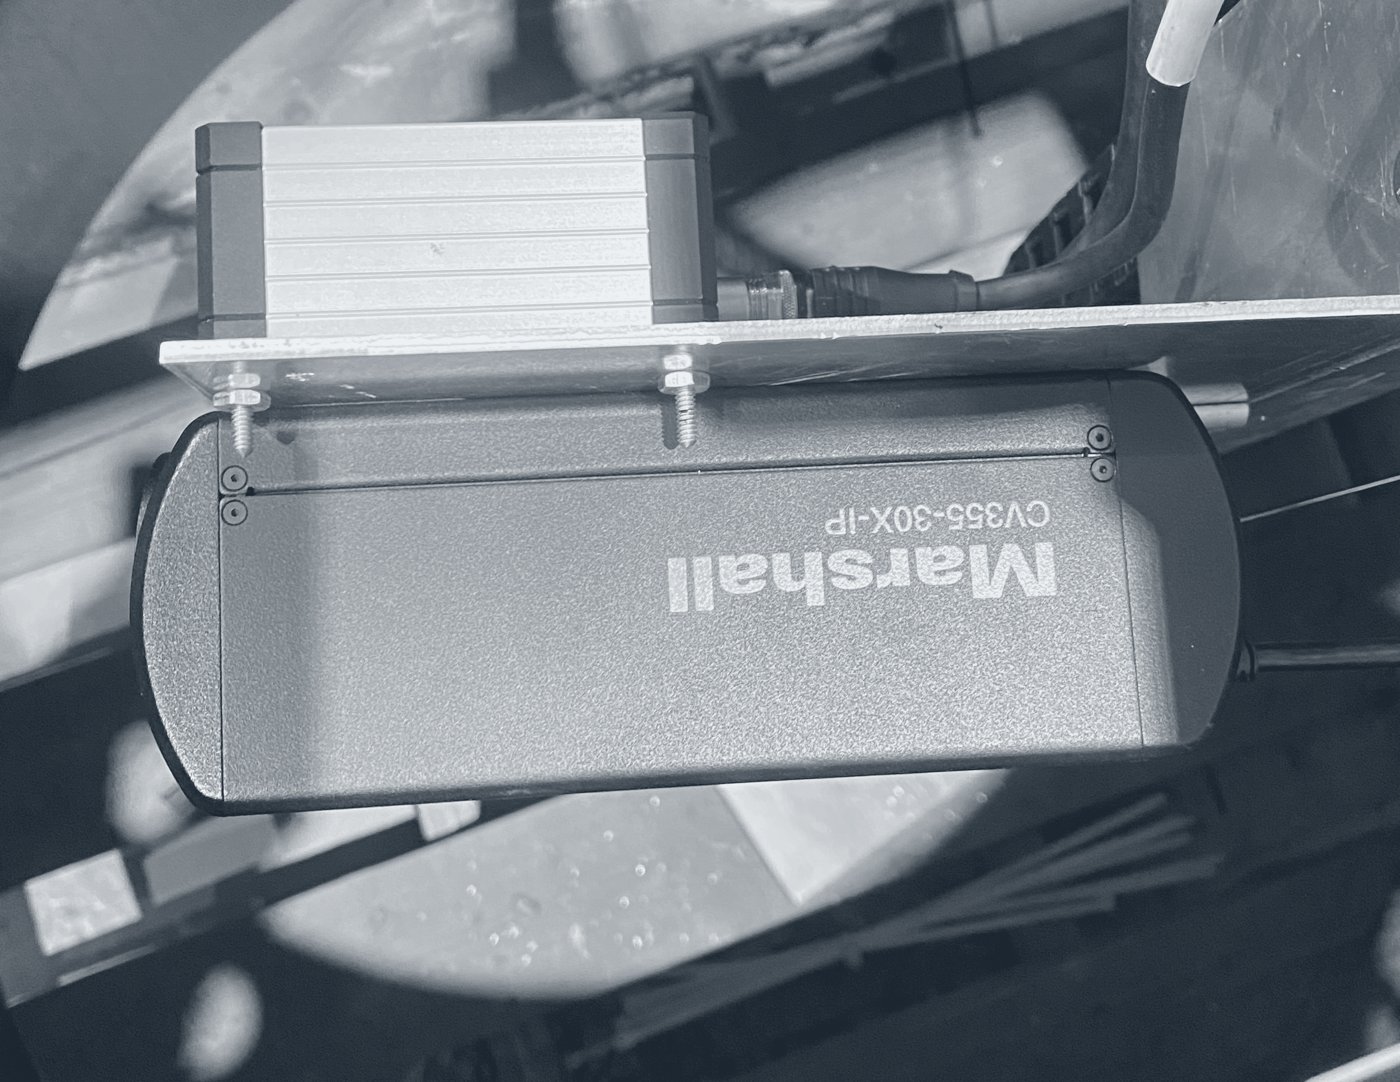
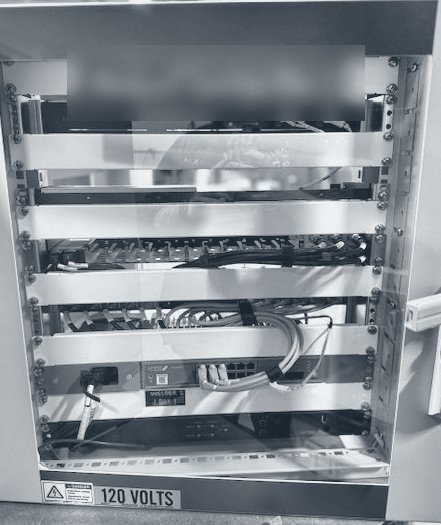
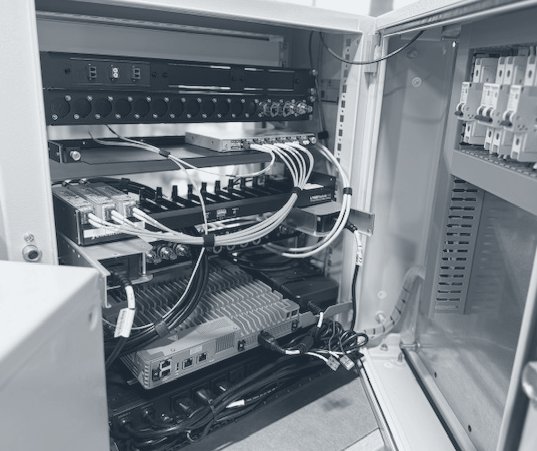
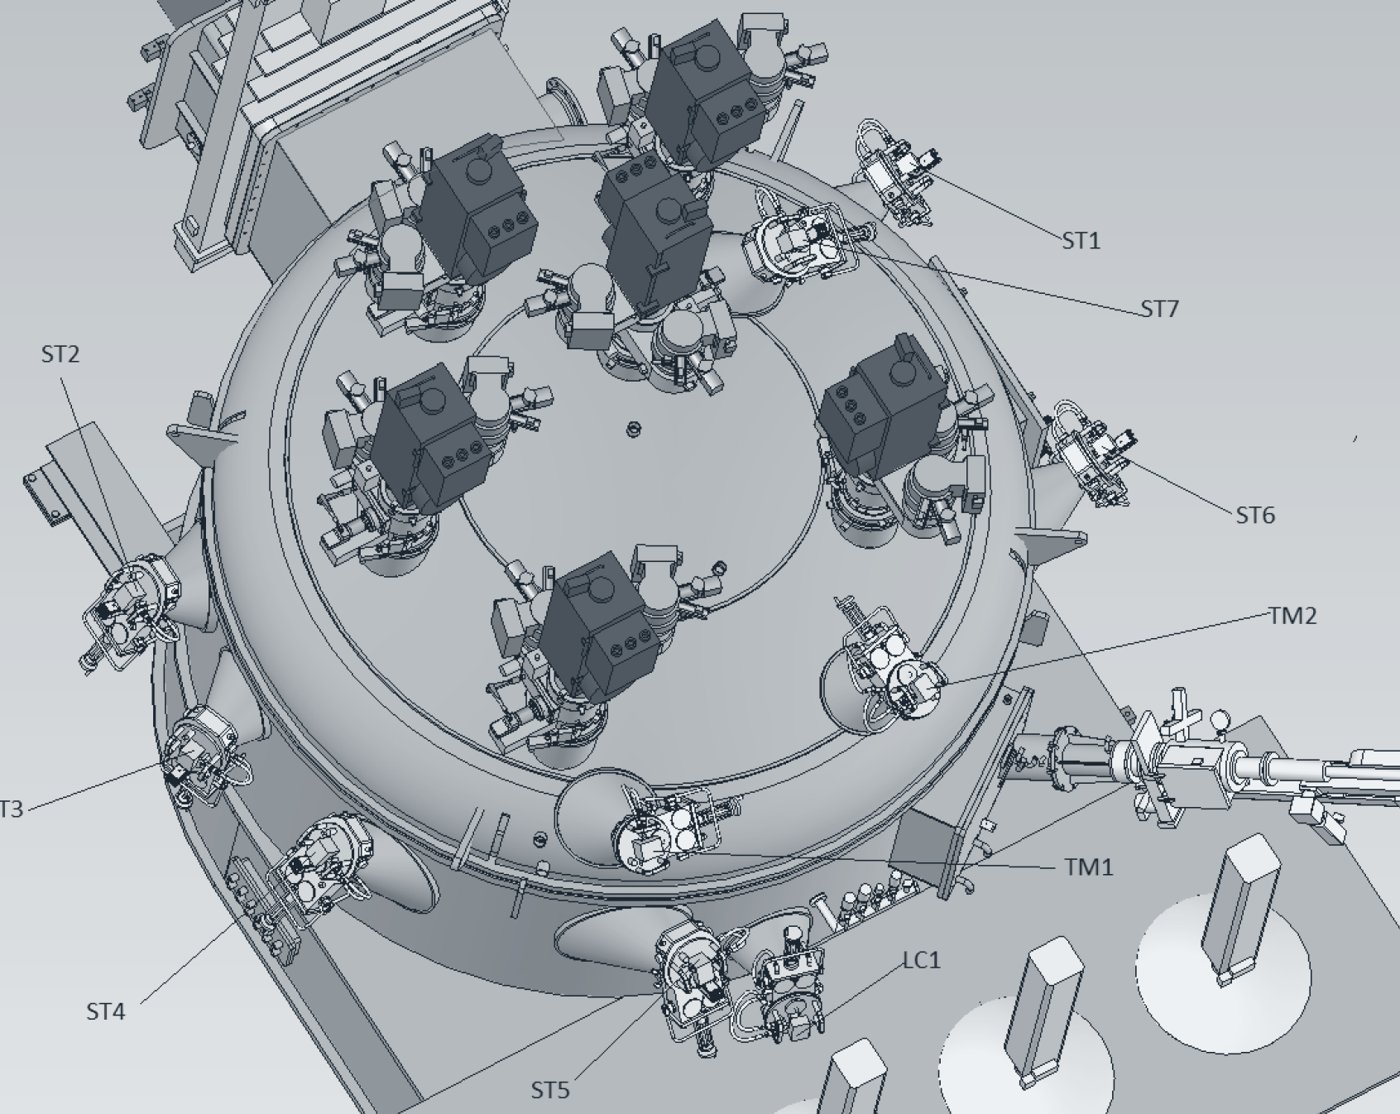
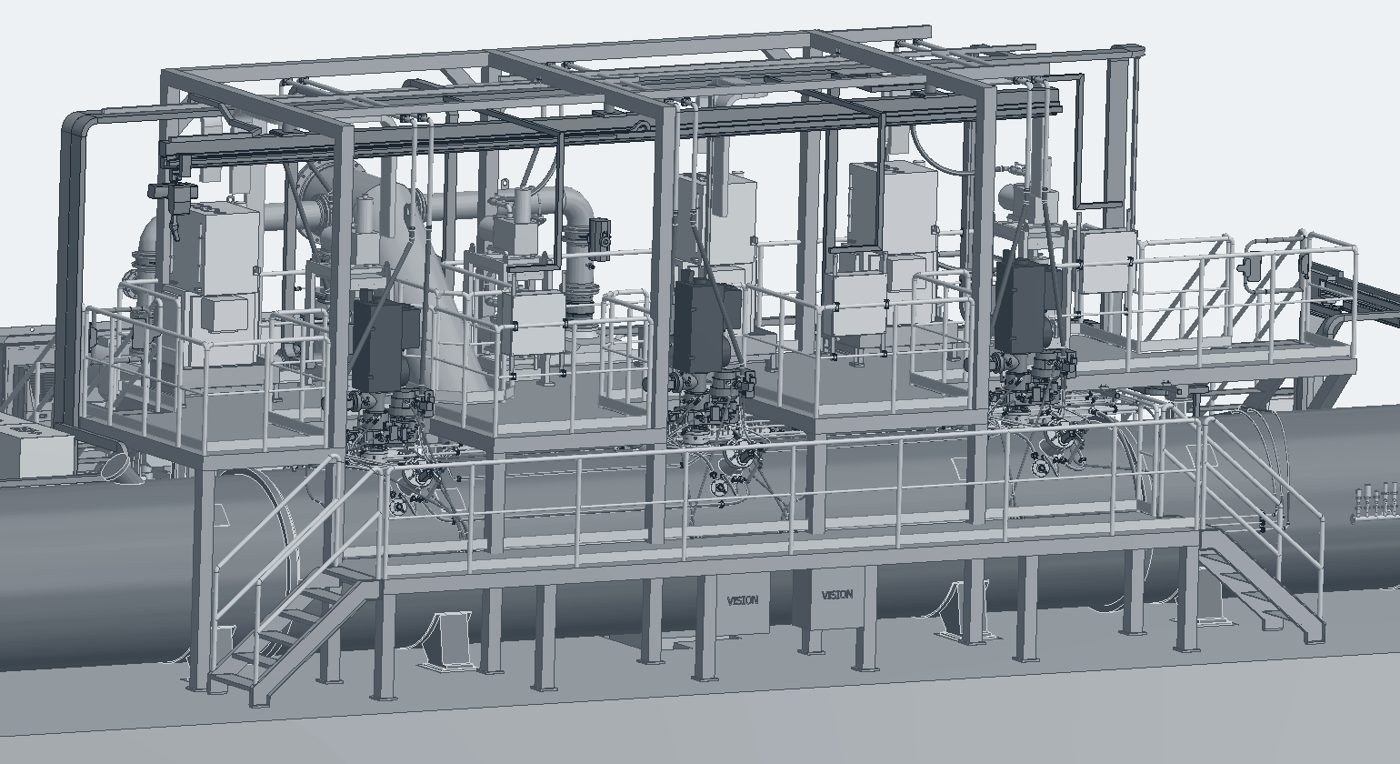
Sensing: 150 cameras, 20 thermal imagers, 35 laser measurement systems, five to eight cameras per furnace at the greenfield plant; 25+ units in shielded, water-cooled, purge-air housings behind vacuum-rated viewports. Transport: three independent outputs per camera, SDI over fiber (CWDM, several 3G and 12G-SDI feeds per strand, a 40×40 video router) to analytics, Ethernet to recorders, HDMI to the operator displays. Compute: 30 rack-mounted GPU servers running detection, segmentation, tracking, measurement and decision logic, with a video historian that records around the clock to cloud storage and became the training-data source for every later model. Integration: PLCs over OPC-UA, the MES and the plant historian; two interface points per system. People: operator displays and alarms, engineering review of recorded events.
Design rules
- Standardize the hardware so scaling is routine. A new site reuses the stack instead of designing from scratch.
- Three paths per camera. Redundant signals reduce failure points; the operator's view survives any analytics fault.
- Two interface points per system. Minimal coupling to the process controls; changes while the furnace runs.
- Operator in the loop, automatic fallback. Alarm, decision support, then action only if no one responds. The PLC, not the model, holds every interlock.
- Measure against a second reference. Camera against laser on the same part, detections against injected events, ratings against an engineer.
- Networks trace, geometry decides. Where a number gates a process, a neural network finds the part and deterministic geometry produces the number, so the result generalizes and can be audited.
Verification and rollout
- Factory acceptance testing before installation: every camera and fiber link powered and imaged end to end; router, recorders and servers configured and load-tested; the analytics models run on recorded video on the production servers; PLC and MES interfaces exercised with the furnace OEM. Electrical schematics, cable labeling and control-room display layouts owned by the function.
- Model updates are validated offline on recorded video, then deployed in a maintenance window; video is stored in the cloud, so the record is not retention-limited.
- Assurance gates before any model is fielded: FMEA and hazard analysis with documented safety cases, acceptance criteria, calibrated confidence thresholds, runtime input-quality and drift monitors.
- Detection validated against injected ground-truth events, 95%+ detected, before fielding.
- Greenfield plant: seven furnaces instrumented from site inception, milestones met. Second plant: six months with zero reported failures. Across the platform: zero production downtime through every rollout.
Scale: copy to the next plant
A new site does not get a new design. It gets the reference kit, the same parts, drawings and procedures, and moves through the same four maturity stages. That is how one system on one furnace in 2016 became a company standard at eight or more plants by 2026, with a greenfield plant instrumented from inception. Read-across is a business lever as much as an engineering one: less repeated engineering cost, shorter deployment time, and site teams that trust what arrives because it already runs elsewhere.
Repurpose: the same capability on a different process
The capabilities are not tied to the process they were built on. Rare-event detection trained on one process became defect and side-arcing recognition for a castings division; the measurement stack became billet straightness and cut guidance at a forge press and CT defect detection for castings; process analytics moved to an electron-beam furnace. Each move reused validated architecture and software patterns, which is what makes the portfolio a corporate asset rather than a set of plant projects.
Part 3 · Case studies
Case studies: the engineering in depth
Six systems, written for an engineer: the decisions and what they cost, the sketches, the governing mathematics, the measured impact and the limits. Herscovici wrote production code for each of them, in Python with PyTorch, OpenCV and scikit-learn, with Databricks and Spark for the investigation pipeline and OPC-UA for the controller integration, alongside the engineers who now maintain them.
Data
Rare-event strategy with confirmed events fed back into training. Segment Anything fine-tuned on 1,000 to 10,000 labeled images per task and used to mass-label the datasets that train other models.
Evaluation
Injected ground-truth events (95%+ detected); per-stage false-positive counts against known events; ratings benchmarked against an engineer; camera measurements benchmarked against a laser instrument; a domain-shift monitor that rates each video against the training set.
Deployment
30 rack-mounted GPU servers and edge devices; models pruned 50%+ in size with better accuracy on under-represented data; ONNX and TensorRT; Databricks, Spark and MLflow for the large reviews.
Operations
Assurance gates before fielding; runtime input-quality and drift monitors; a video historian as the training source; on-call and incident response for systems in service.
Expand all · The code is under NDA; the patents and the paper are the public record.
Machine perception and rare-event detection
01 Rare-event detection and tracking in production video (image-suitability method: U.S. application pending)Resolved a first-of-its-kind jet-engine material defect for nine OEMs, measured by 95% fewer false positives at 95%+ recall, 100× less manual review and an ~80% lower projected review cost, by designing a three-stage detector with multi-target tracking and a domain-shift monitor, and running the review on a weekly schedule as customer-facing technical lead.
Problem and constraints

Debris that falls into the melt can leave a defect in the ingot. It enters through the narrow gap between the electrode and the crucible, stays visible for a few frames, and can appear at any point in a melt that runs for hours. Only 73 confirmed events existed for calibration; lighting and camera quality varied across furnaces and years; and every flagged event had to hold up as evidence for customers.
Decisions and trade-offs
- Three small stages instead of one large model. About eight detector variants were benchmarked per melt stage. A tiled nano detector with a high-resolution P2 head, a random forest on a 2,242-feature crop and a temporal filter kept recall on few-pixel particles at a fraction of the compute of a single large model, at the cost of three models to maintain.
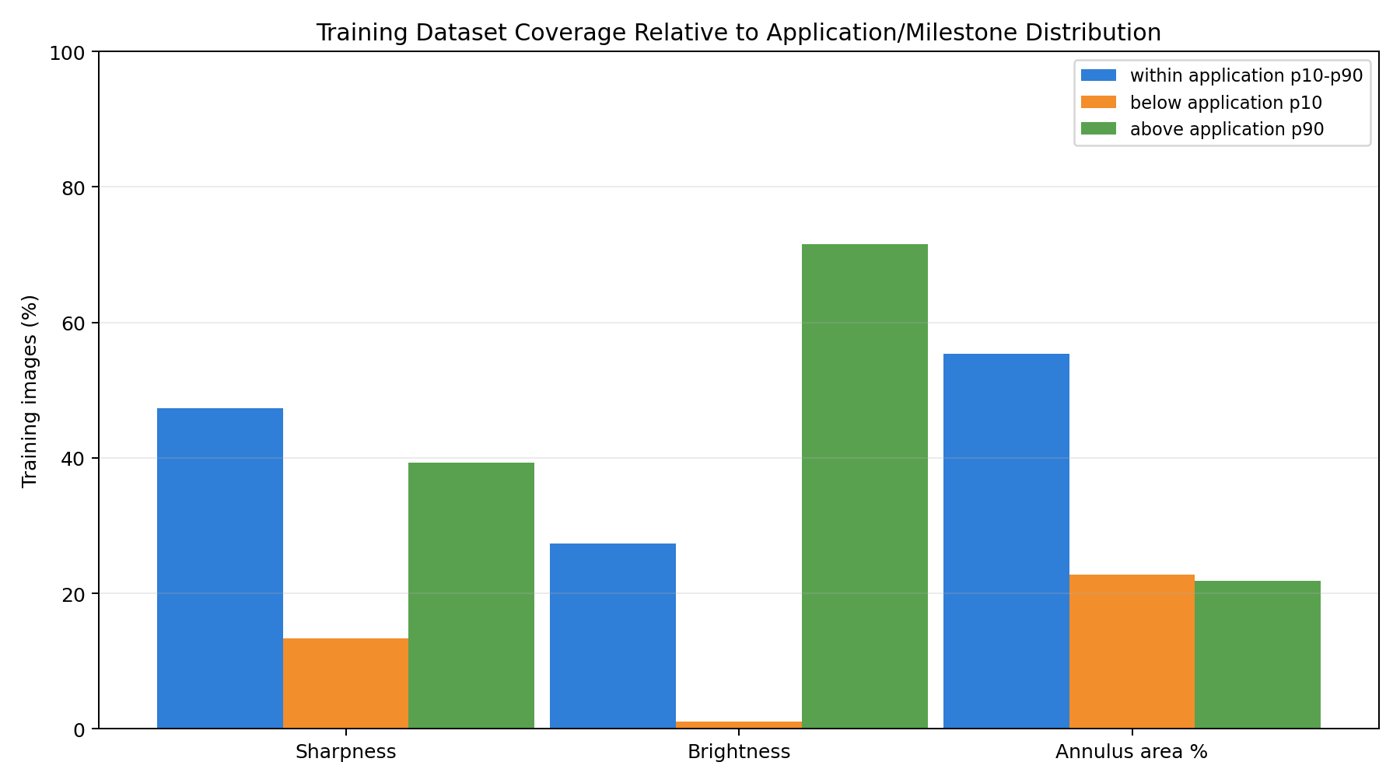
- Rate the data, not only the model. A domain-shift monitor scores each video against the training distribution. It showed most field video was darker than the training images, which pointed the fix at the camera image rather than at more training.
- An evidence standard over speed. Every flagged event carries a timestamp, a saved frame and an engineering review before it reaches a customer. It slowed the pipeline, and it is why the results held with nine OEMs.
Solution
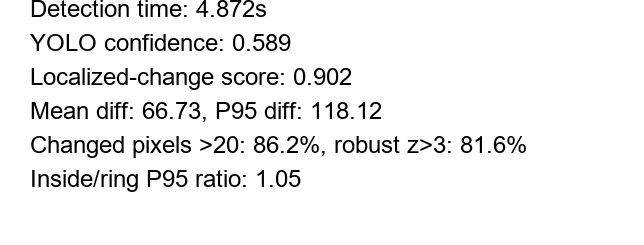
Multi-target tracking follows each particle frame to frame; its trajectory tells debris shed by the electrode from debris released by the crucible wall. Because camera zoom differs between furnaces, size is measured against the gap, whose width is known. Melt-generated debris carries no weight; other particles are weighted by size, doubled when the trajectory starts at the electrode weld:
The domain-shift monitor samples 150 frames per video, finds the melt region M and computes its size A, sharpness S and brightness B; each video is represented by the 25th percentile of its frame metrics, scaled by the training interquartile range and averaged into one distance:
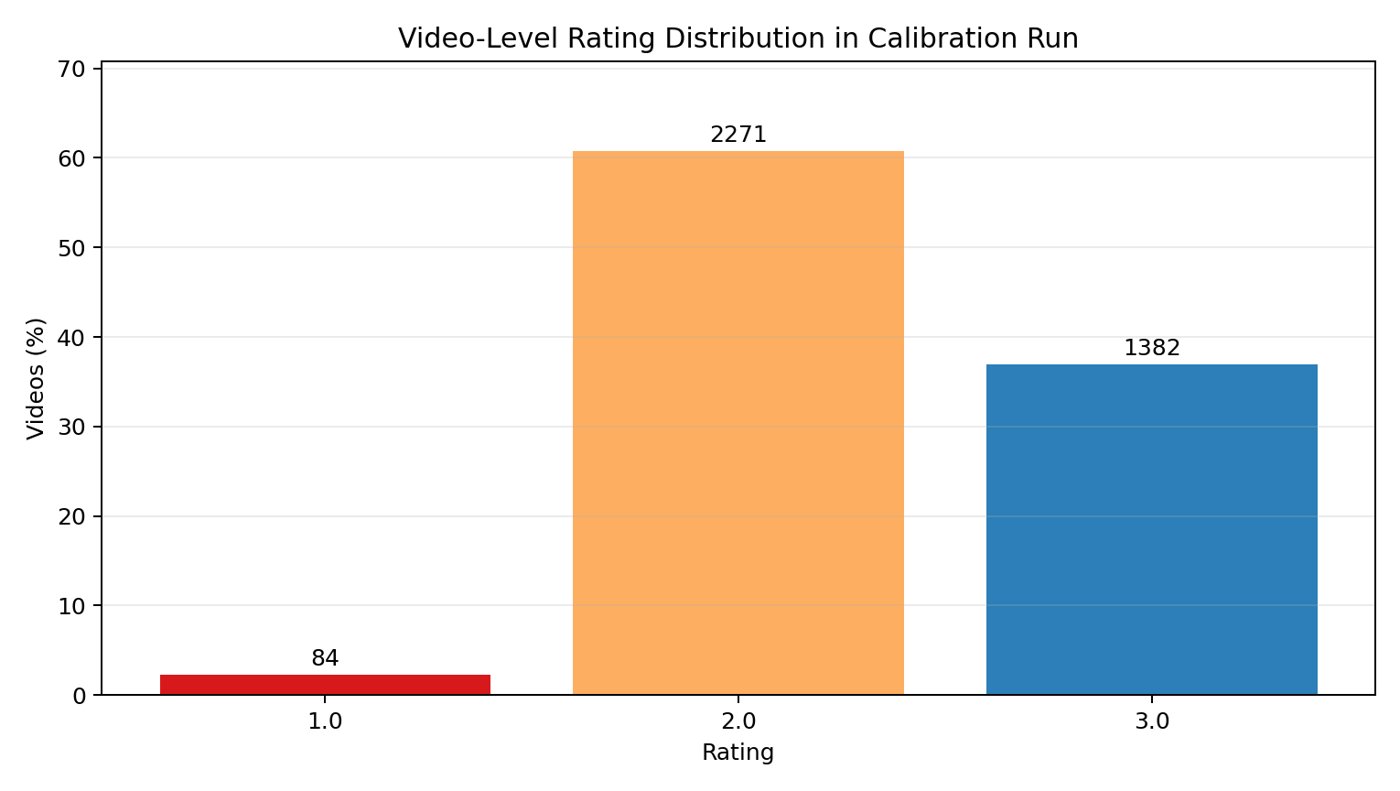
Video was fused with timestamp-aligned controller telemetry and processed on Databricks. The models were trained on 30,000+ hours of production video. A weekly schedule tracked all 1,132 runs through export, upload, processing, engineering review and group review against plan.
Impact
Manual review fell 100-fold, with 95% fewer false positives at 95%+ recall; the three-stage detector replaced manual review of raw video. The investigation resolved the defect. The pipeline now serves as an investigative tool for past melts and has reviewed more than 1,000 hours of video.
Limits
Calibration rested on 73 confirmed events. Field video rated 2 or 3 on the domain-shift scale sits outside the center of the training distribution; the monitor flags that, it does not fix it. Recall is stated on confirmed events, not on events no reviewer saw.
Vision systems for dimensional metrology and inspection
02 A measurement that gates a process step: weld rating (provisional patent filed)Replaced a visual weld judgment with a reproducible gate on the melt, measured by a 1-to-5 rating in 5–10 seconds, ~85% agreement with an engineer mid-development and a PLC interlock on every failed weld, by building two segmentation networks, a radial-coverage geometry and a fail-closed PLC and MES integration.
Problem and constraints
Before an electrode is melted, the weld joining it to its stub is rated, because weld material can break away and fall into the melt; a particle from the weld carries twice the risk weight of any other in case study 01. Operators rated the weld by eye, so it varied between shifts. The scene is a shop floor with people, equipment and lighting from dark to bright; the result is needed within seconds; a missing answer must stop the process; and every rating must be traceable to heat, electrode and operator.
Decisions and trade-offs
- Segmentation and geometry instead of a classifier. A first version rated welds with a bounding-box network and could only recognize conditions it had been trained on. The second traces the weld and the electrode and rates by coverage geometry, which costs a second network and generalizes: a deliberately bad weld outside the training set was rated correctly.
- Two cameras, not one. The top sector of the electrode is poorly visible from one viewpoint, so each welder has two cameras about 180° apart, each rating the sector it sees well.
- The PLC holds the interlock and the system fails closed. No electrode edge found means no rating and a locked welder. A software-only gate that passes on uncertainty was rejected.
Solution
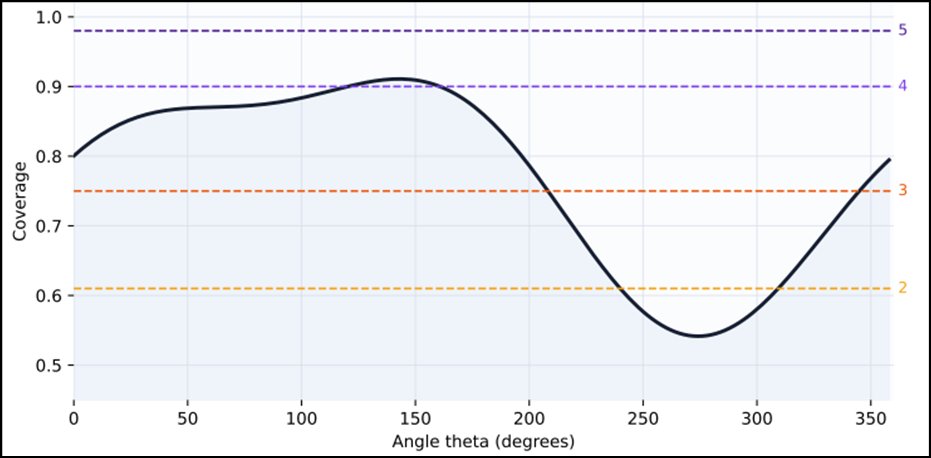
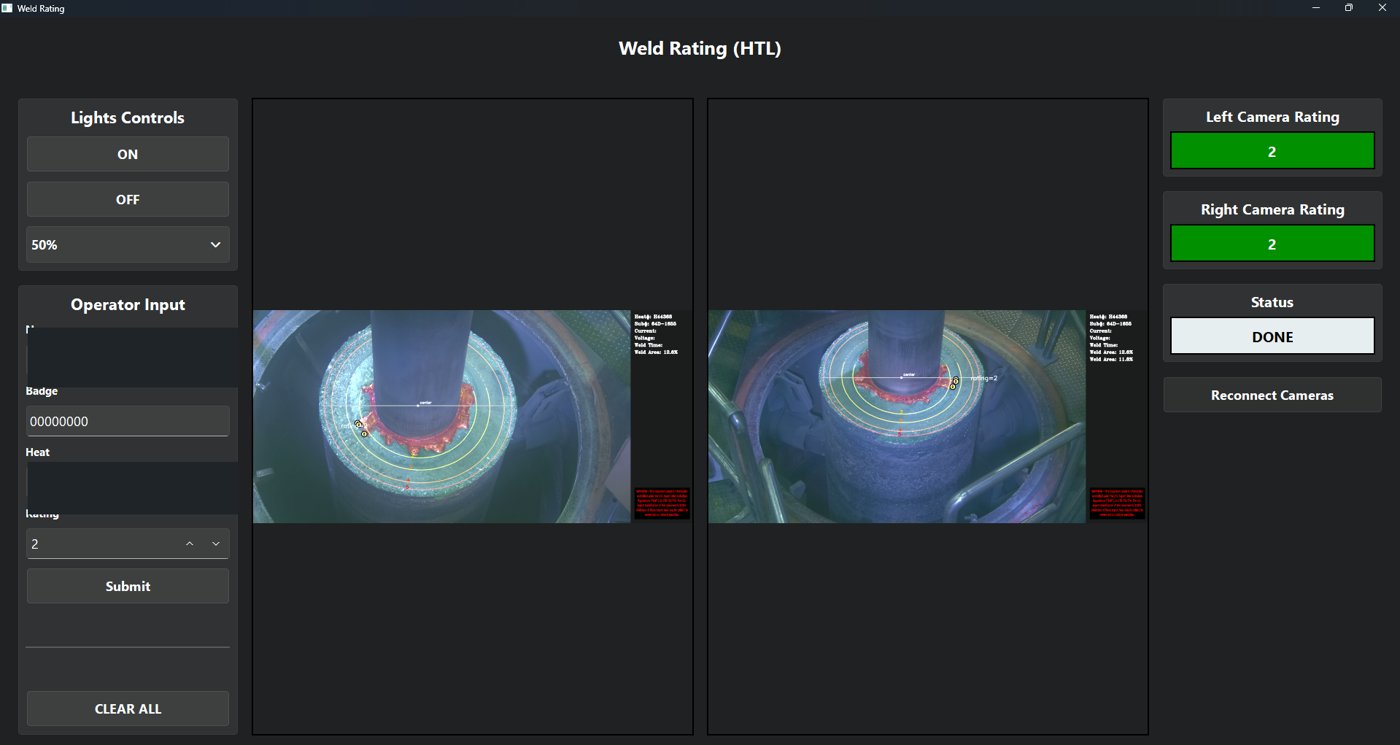
One CNN traces the weld contour and a lighter CNN finds the electrode boundary. A best-fit ellipse to the electrode mask gives a center; rays cast from it through 360° record the furthest electrode point re(θ) and the furthest weld point rw(θ) on each ray. Their ratio is the coverage, and the furthest protrusion sets the rating:
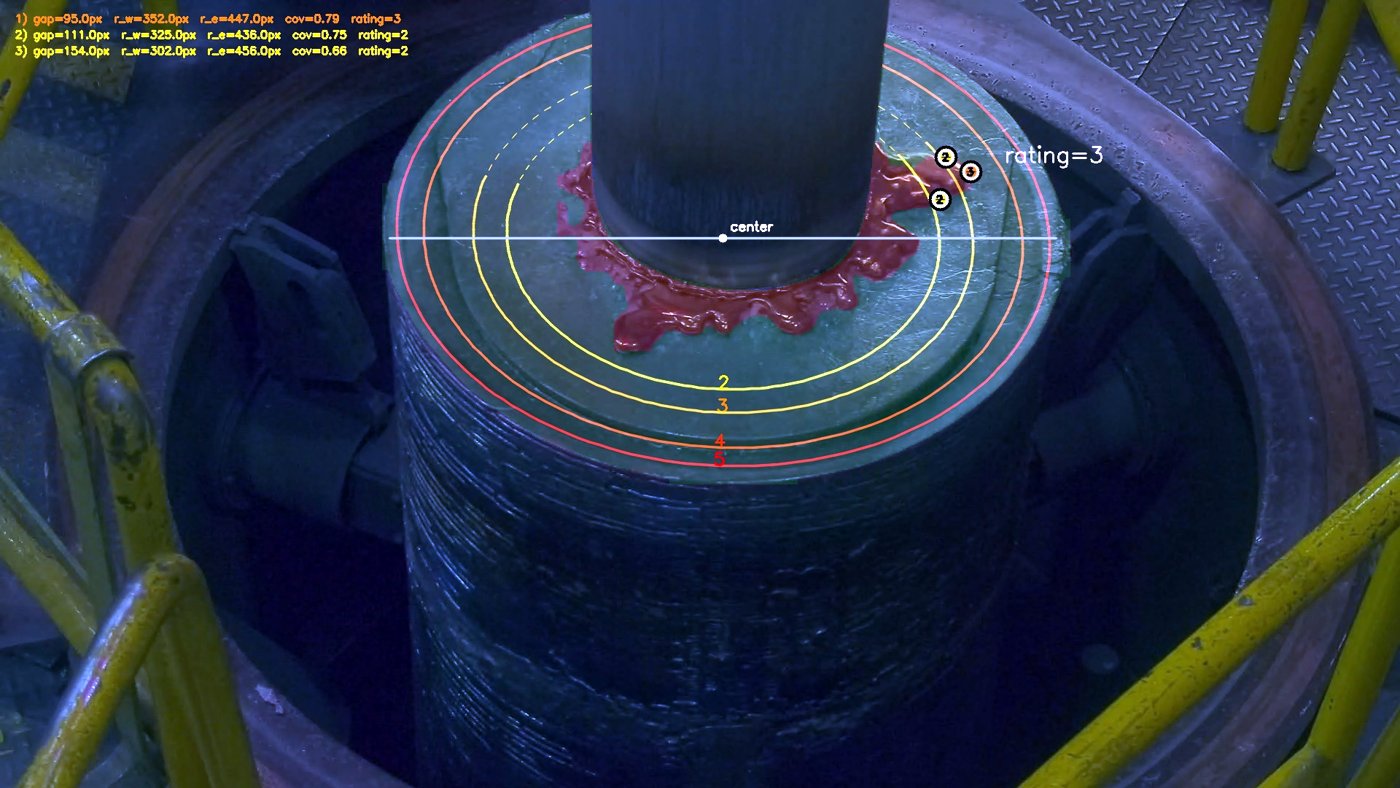
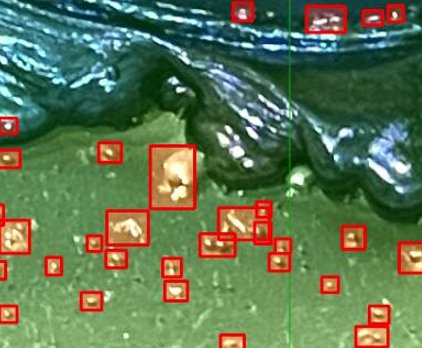
The same networks locate the weld so the camera sets its own zoom, iris and focus. A second capability detects every spatter particle on the electrode face, about 1,000 in one image, and reports a size distribution for trending. Heat and electrode identifiers come from the control system; the operator's rating triggers capture; the computed rating returns to the PLC and, with both images and both ratings, to the MES record.
Impact
The rating is a reproducible measurement delivered in 5 to 10 seconds; a weld that fails cannot proceed to the furnace; every weld has a traceable record. A provisional patent application covers the method.
Limits
Agreement with an engineer was about 85% on a 27-image set mid-development, with the disagreements at rating-band boundaries, so the band thresholds are the sensitive parameter. The spatter measurement trends; it does not gate.
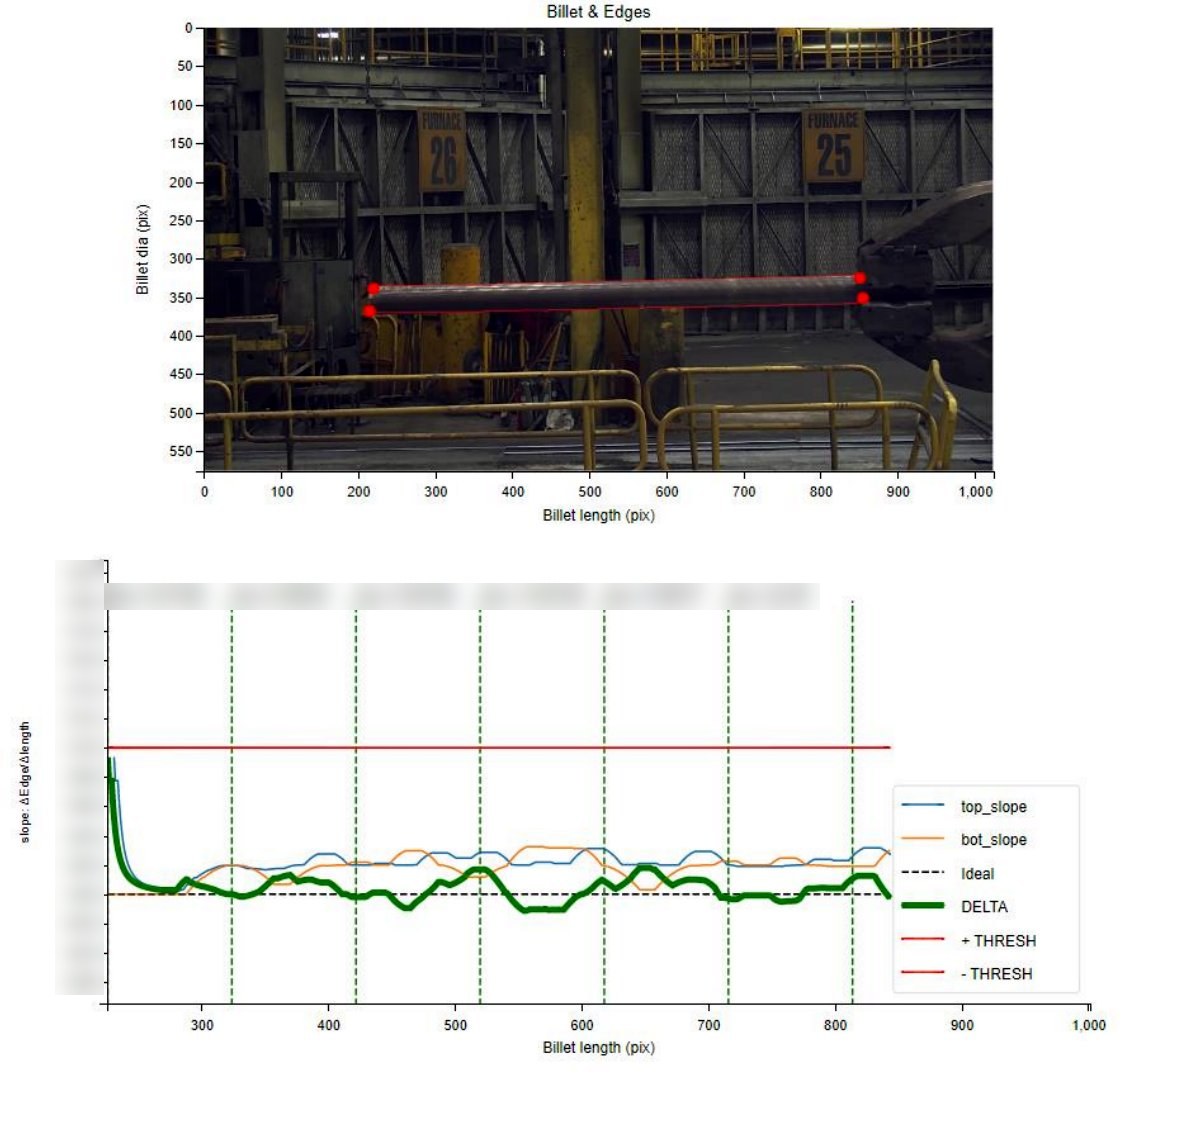
03 Multi-sensor fusion on one record: straightness, hot and coldMeasured billet straightness at the forge press in real time, measured by 4K video collected 24/7, hot results benchmarked against the cold laser scanner on the same billets and results on the operator's pulpit display, by combining semantic segmentation with least-squares edge slopes and fusing both instruments on one MES record.
Problem and constraints
A forged billet has to be straight, and straightness is set while it is hot. The laser scanner is the accurate instrument but only exists after cooling. At the press the billet glows, changes color, sits in front of a cluttered background and varies in diameter and length; pixel-level edge noise is amplified by a slope; and two instruments at two stations need a shared identity.
Decisions and trade-offs
- Measure hot, and benchmark the measurement. A camera at the press is less accurate than the laser and arrives in time to act on, so both were built and the camera result is calibrated against the laser result of the same billet.
- Segmentation over classical edge finding. Version one found the billet with a detector and the edges classically; it broke on clutter and on changes in diameter, length and color. Version two removes the background with semantic segmentation first.
- Filter before differentiating. Edge coordinates pass through a median filter (windows of 11, 25 and 101 samples were compared) before the slope is taken.
Solution
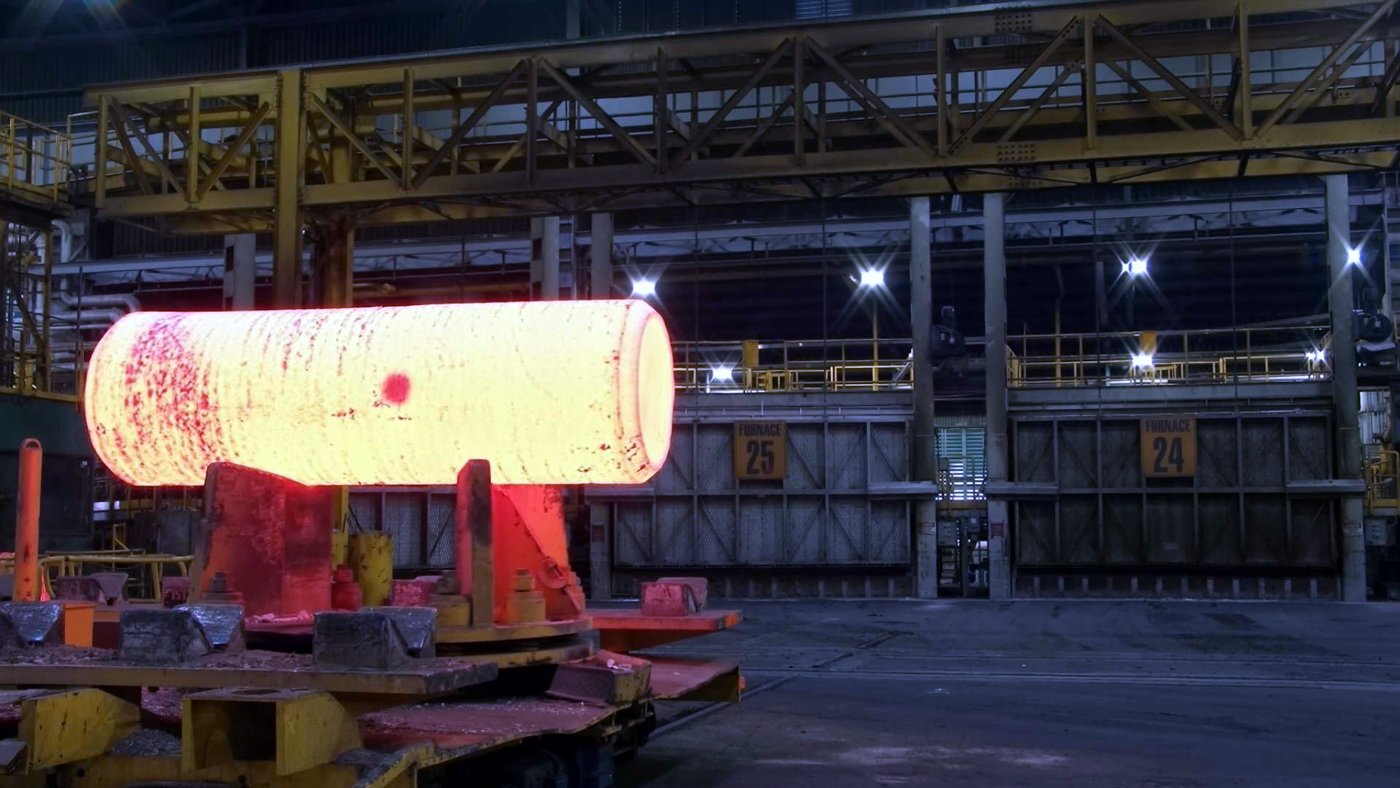
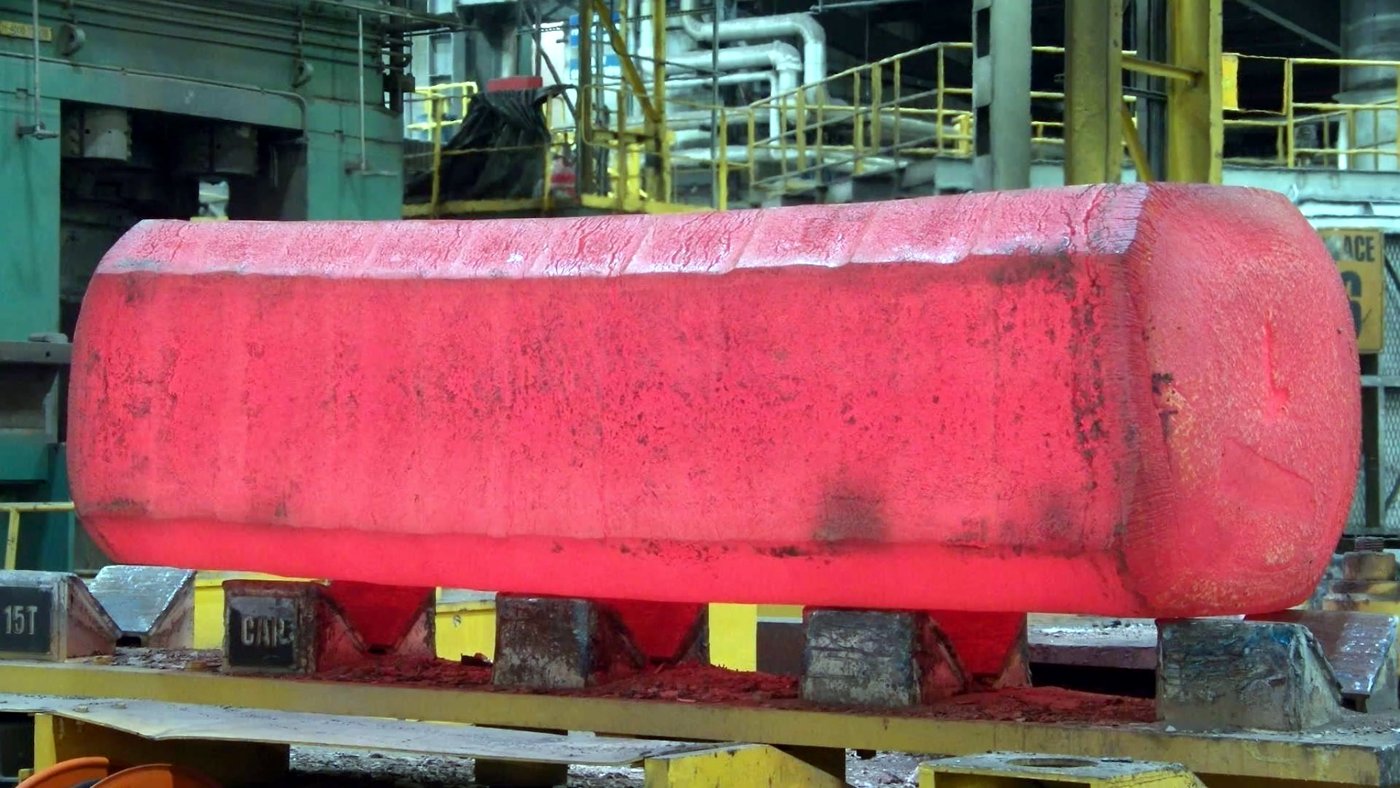
Straightness is a change in diameter over a change in length, the slope of an edge. Each edge is a least-squares line through its pixel coordinates, and the difference between the top and bottom slopes is the average straightness, compared with the 1 mm/m criterion; for billet i the hot and cold results sit under one MES identifier and are compared:
Impact
Straightness is measured at the press in real time from video collected around the clock and goes to the operator's pulpit display; the hot measurement is benchmarked against the laser measurement of the same billet on one MES record. It is stage three of the platform roadmap in practice: from seeing a billet better to measuring it against a second reference.
Limits
The hot-versus-cold comparison was made on specific heats, not every billet. The camera result's engineering meaning comes from that calibration, not from pixel slopes alone.
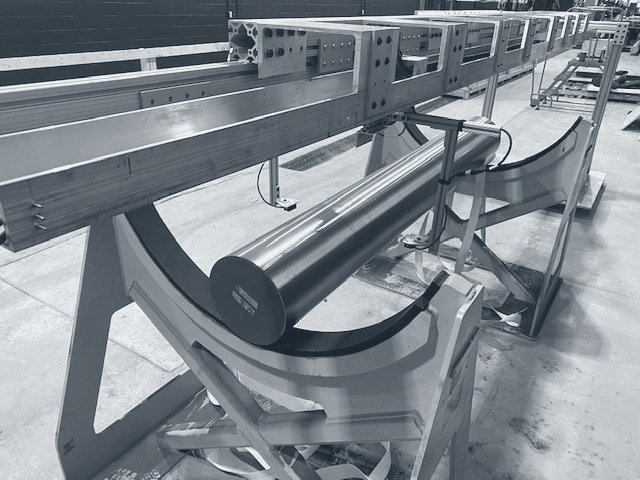
04 Laser metrology and in-process control (US 2025/0277286 A1)Put inspection on a measured footing, measured by about 80% of final-melt crucibles at one plant scanned, an LMPC 2024 Most Innovative Work Award and a pending patent on shelf detection, by building a laser-and-camera crucible scanner and the in-process measurements that feed arc control.
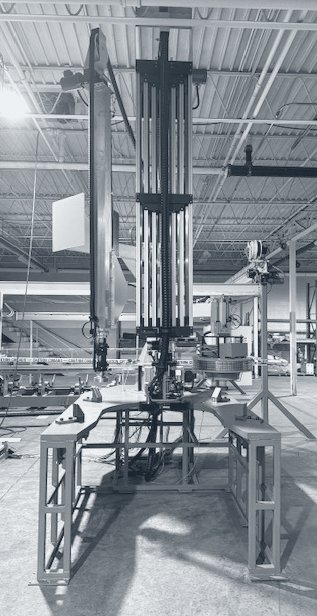
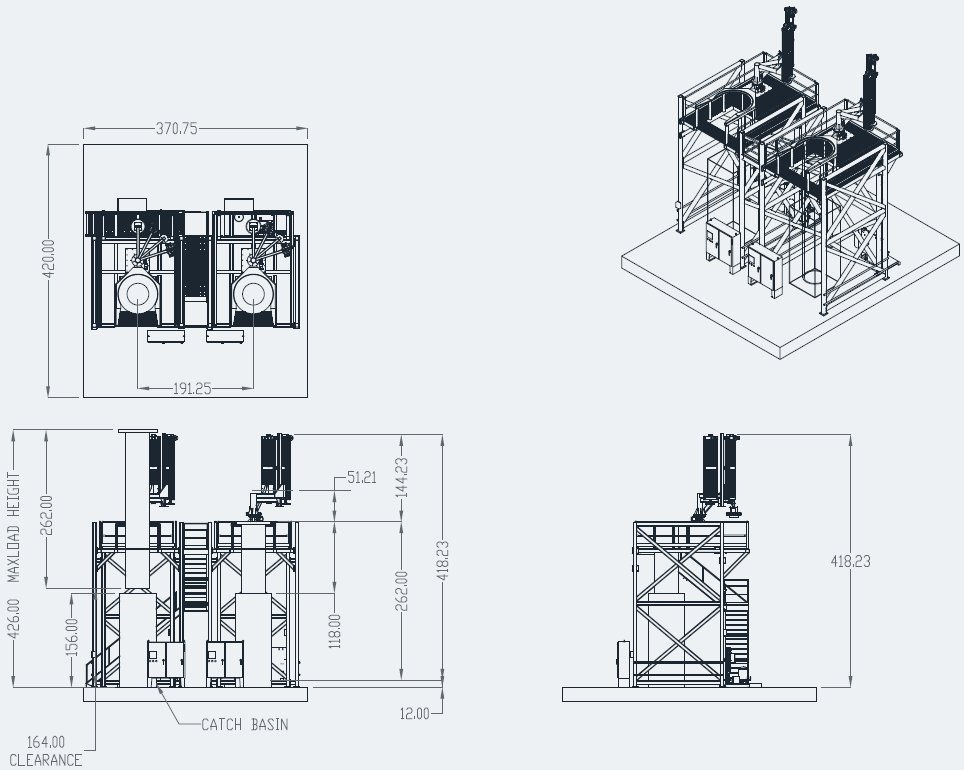
Crucible inspection scanner. A telescoping laser-and-camera head scans each crucible in height and angle (six lasers at 60°, 50,000+ points per second), measures circularity, taper, spatter high points and arc gouges, flags defects with an ML model and tracks each crucible's health by ID.
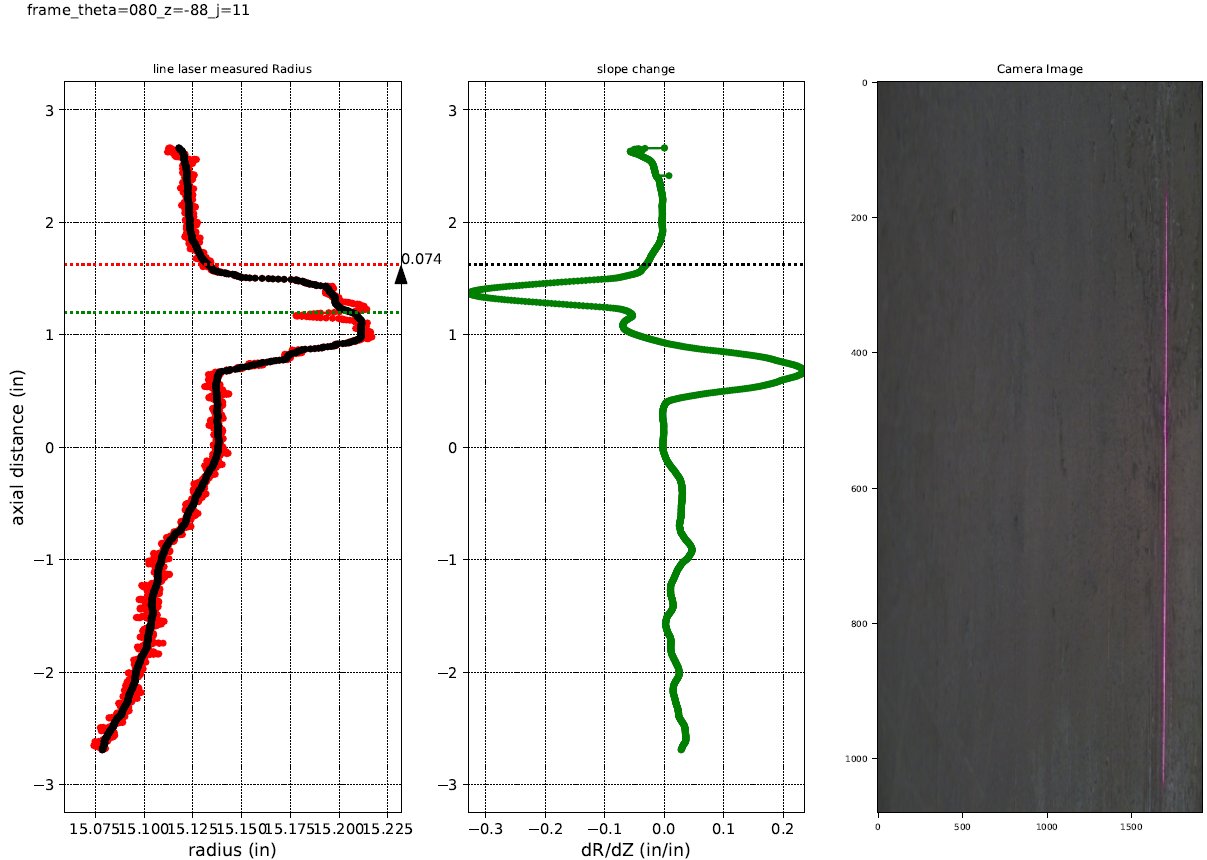
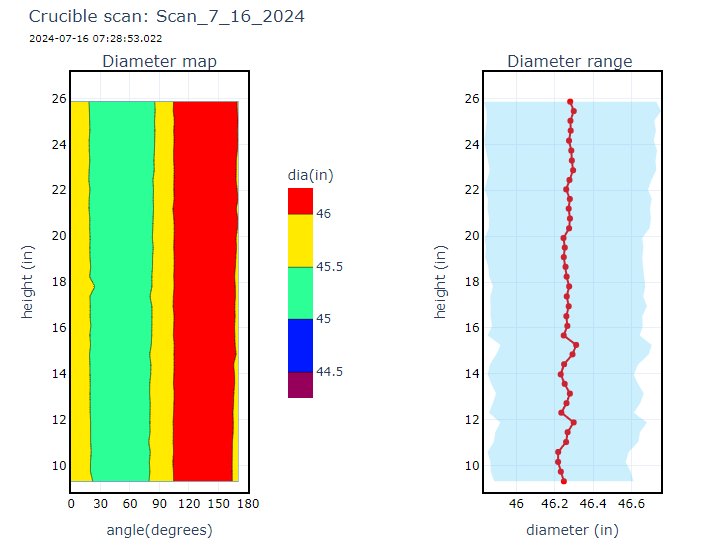
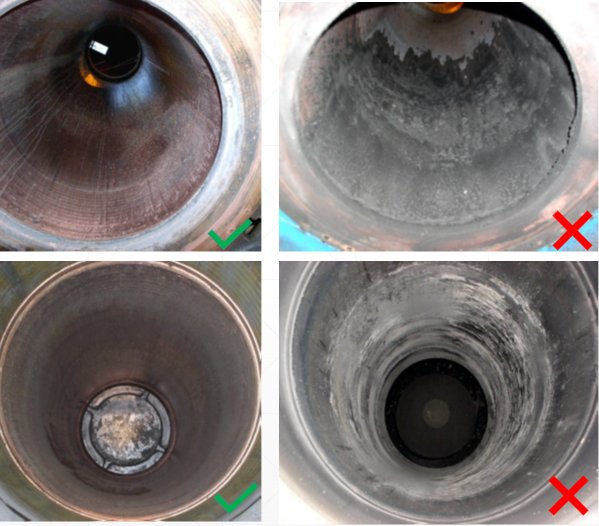
Shelf detection and control. Spatter can build up on the crucible wall as a shelf that later breaks off. A CNN selects the region of interest, edge detection finds the crucible, shelf and electrode edges, and the shelf's share of the gap sets the coil current that steers the arc (US 2025/0277286 A1, pending):
Also in production. Alignment and centering checks before the melt (electrode-stub concentricity, weld centering, electrode geometry, electrode-crucible centering, ram centricity); real-time electrode-crucible gap and arc monitoring; electron-beam furnace analytics (condensate, liquid level, casting rate, mold temperature); automated quality scoring of each run from its video; ingot surface rating to the plant historian; wafer flatness; nonconformance decisions from process data; laser cut-location guidance to the saw after operator confirmation; forge-press personnel safety monitoring; CT defect detection and process vision for castings divisions.
Controls, mechanical design and automation
05 Closed-loop process control from vision (US 12,332,611 B2)Automated end-of-melt power cutback in production for 3+ years, measured by 85%+ lower prediction error within four months and U.S. Patent 12,332,611, by replacing a licensed, hard-wired first-generation system with an in-house CNN-plus-regression trigger connected to the furnace at two interface points.
Problem and constraints
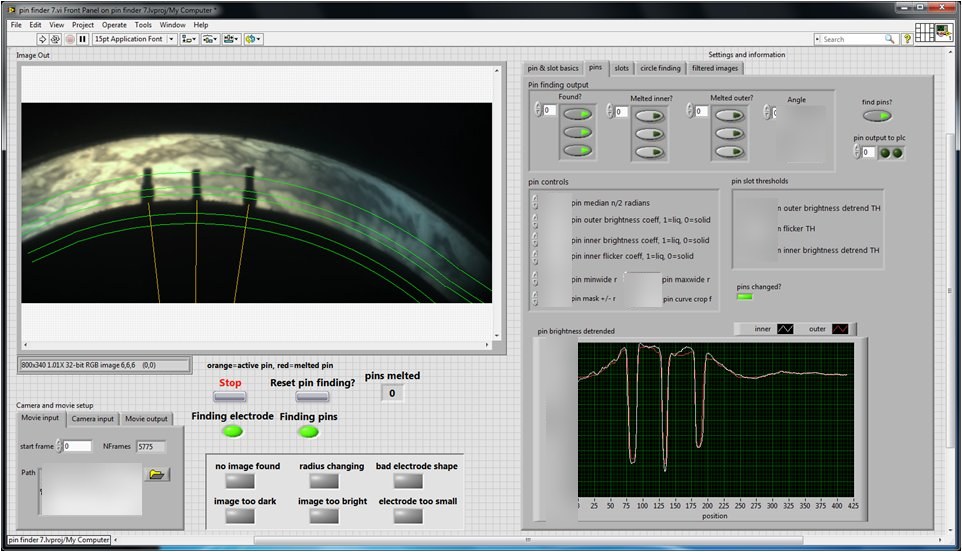
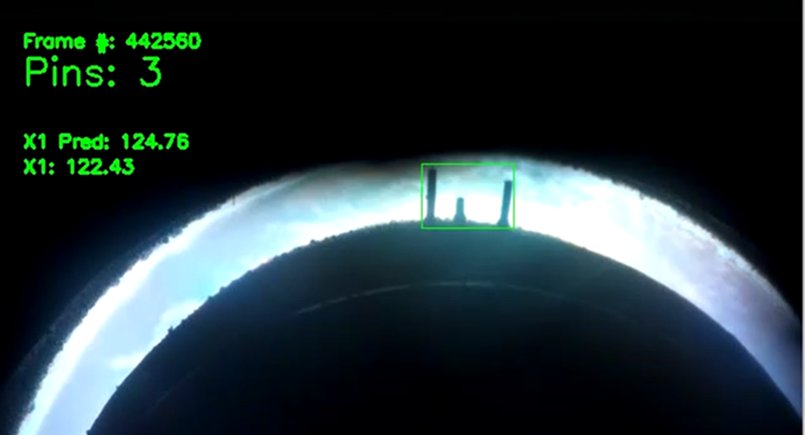
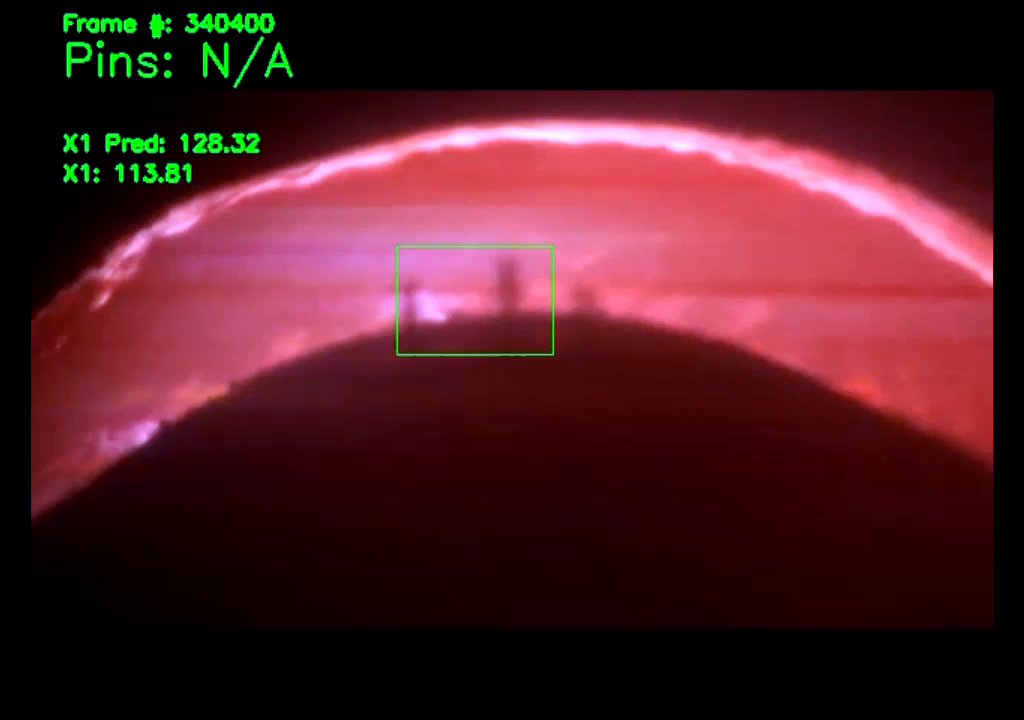
Each electrode carries marker pins at a set distance from its end; when the melt reaches them, power should begin to ramp down, and too early or too late hurts ingot quality. The first-generation system, started in 2014 with the University of Birmingham, was hard-wired into the control room, ran on licensed software and needed specialists for changes that could only be made with the furnace down. The replacement acts on process power, so it must fail safe, cope with visibility that varies between furnaces and over a melt, and be maintainable by plant engineers.
Decisions and trade-offs
- Rebuild in-house rather than keep paying for the first generation. The rebuild took from 2016 to production-ready code in 2019; in exchange the plant owns the system and the framework carried a dozen later systems.
- Two independent triggers. Pin counting from video and a regression on process data can each start the cutback; together they cover frames where visibility fails and runs where the process drifts.
- Operator first, automatic second. A fully automatic cutback was possible. The chosen design alarms, offers decision support, and acts only if no one responds.
Solution
A convolutional network detects and counts the marker pins in each frame. In parallel, a regression on process parameters pj (electrode weight, current, voltage) predicts the ram position at which cutback is due; either condition starts the power-adjustment phase:
The rollout replaced bespoke parts with standard cameras, fiber to every furnace, rack servers, PLC-to-PC cards and video storage under IT policy agreed in advance. A decentralized video historian gave engineers direct access to footage and became the training source for later models.
Impact
Prediction error fell 85% or more within four months of development. The system has run in production for more than three years, won the LMPC 2022 Best Paper Award, and its framework (standard hardware, two interface points, tools plant staff can troubleshoot) carried gap measurement, shelf detection, arc monitoring and debris detection, and crossed to an electron-beam furnace, a forge press and a castings division.
Limits
Pin visibility varies between furnaces, cameras and the course of a melt; the regression trigger exists because the vision trigger cannot be the only one. The 85%+ figure is a development-period measurement over four months.
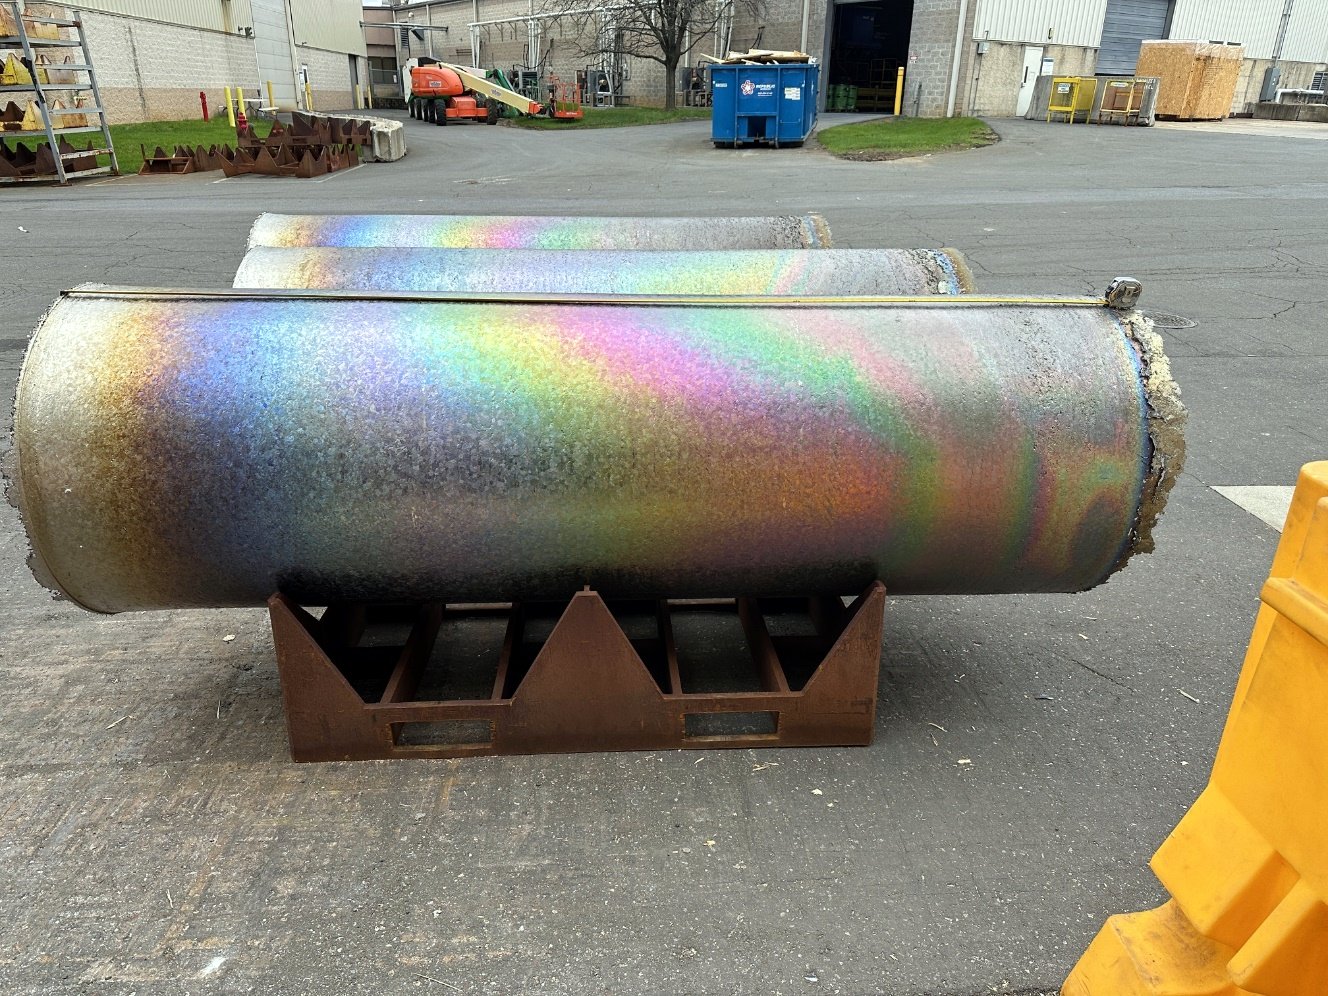
06 Electromagnetic actuation and control (US 2025/0119992 A1)Closed a ~2% ingot-yield gap between two plants, measured by 19+ ingots at the top surface rating, by designing a twin-coil arc-steering retrofit with three-phase PWM drives, PLC control and camera-based verification of arc rotation.
Problem and constraints
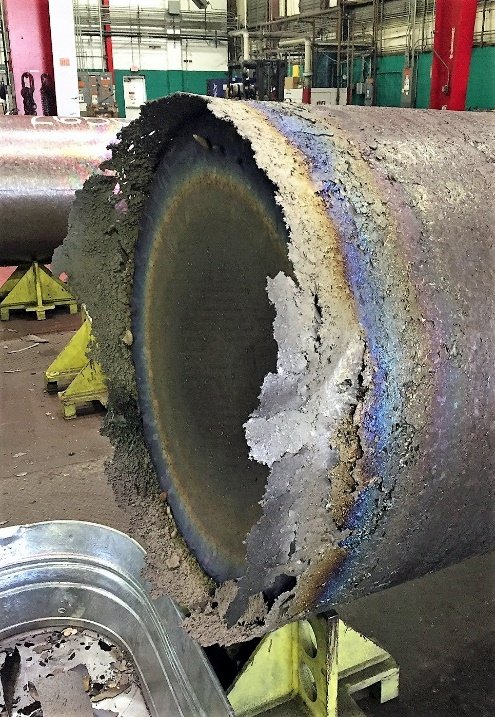
Surface imperfections on an ingot must be ground away, which costs yield. One plant controlled this with an external magnetic field that moves the arc during melting; its ingots yielded up to 2% more. The sister plant's furnaces could not accept that design without structural changes, the field has to follow the arc as it climbs the crucible, and the top of the melt is out of a moving coil's reach.
Decisions and trade-offs
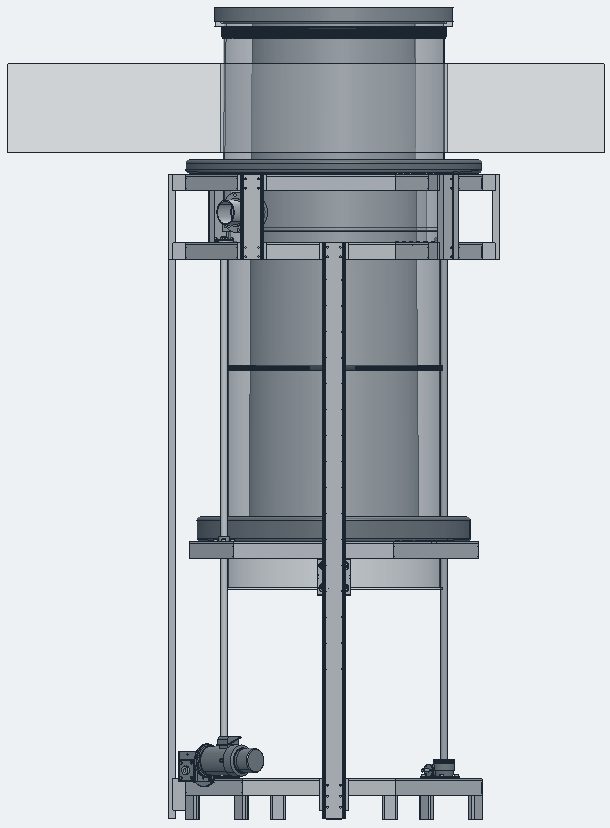
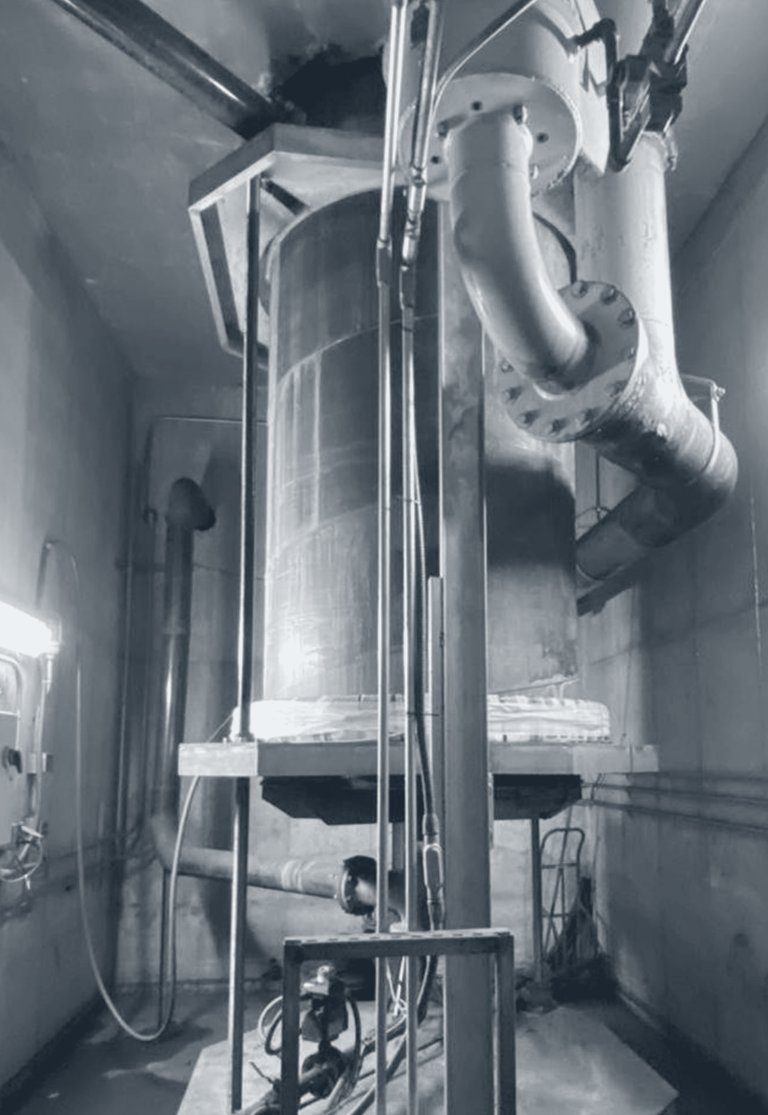
- Retrofit with two coils instead of rebuilding the furnace. A moving coil on a carriage that tracks the arc zone, plus a stationary coil for the top of the melt, fits the existing furnace at the cost of a motion system and a second drive.
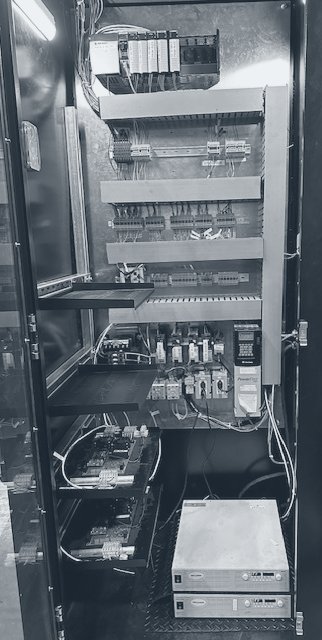
- A bench rig before the furnace. Coils, drives and PLC were built up on a test setup so controls could be tuned without furnace time.
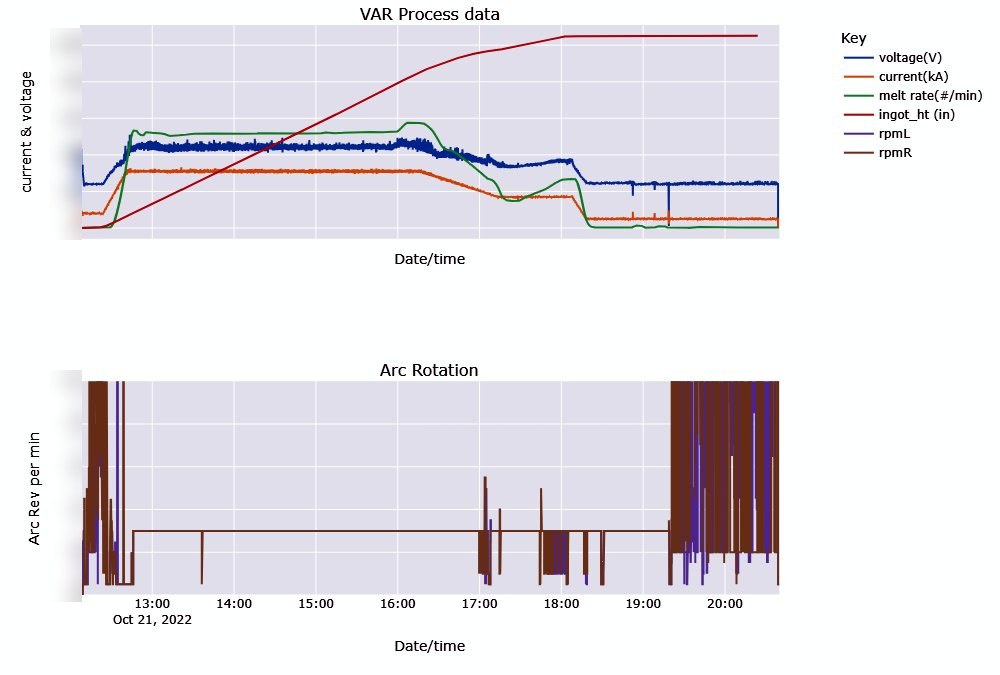
- Verify the rotation. Image analysis of the furnace camera tracks the arc's bright region and confirms one intensity peak per revolution, so the field's effect is measured rather than inferred from coil current.
Solution
Each coil has three pairs of opposing segments driven by sinusoidal currents 120° apart, which sum to a field of constant magnitude rotating at the electrical frequency; the carriage follows ingot height, derived from ingot weight. COMSOL electromagnetic and CFD models set the coil geometry; melt trials set current and voltage, rotation speed and reversal frequency, and coil position relative to the arc gap.
Impact
The system runs in production on the retrofitted furnace and closed the roughly 2% yield gap between the two plants; 19+ ingots have come out at the top surface rating, smooth, with no porosity, blisters or rundown, consistent from melt to melt. The bench rig lets controls changes be tuned away from the furnace.
Limits
The surface-rating result stands on 19+ ingots from the retrofitted furnace; the yield comparison is between two plants with other differences besides the field. The current equation states the design intent, not a measured field map.
Patents and papers
- US 12,332,611 B2Video analysis-based algorithm for triggering power cutback in vacuum arc remeltingGranted June 17, 2025
- US 2025/0277286 A1Shelf detection and control for vacuum arc remeltingPublished Sept. 4, 2025, pending
- US 2025/0119992 A1Twin coil arc sweep system for vacuum arc remelting furnacesPublished April 10, 2025, pending
- U.S. applicationVideo-based algorithm for feature detection and image suitability assessment for VAR meltingPending
- ProvisionalSystem and method for comprehensive weld quality assessment and melt monitoring in vacuum arc remeltingFiled
- LMPC 2022Power Update During Vacuum Arc Remelting Using Vision Systems (A. D. Patel, N. Herscovici)Best Paper Award
- LMPC 2024Crucible inspection systemMost Innovative Work Award
- PCC Tech. Conf.Vision-based weld quality and melt monitoring system (with K. Schwind)Paper, 2026
Patents are assigned to a Precision Castparts subsidiary. LMPC is the Liquid Metal Processing & Casting Conference, where Herscovici also served on the committee. He spoke and led workshops on machine learning and computer vision at PCC's technical conferences each year.
Background
Roles at Precision Castparts Corp.
- 2020–2026Head of Manufacturing Technology and Principal Engineer, R&D
- 2017–2020Senior Manufacturing Process Technology Engineer
- 2015–2017Research and Data Analytics Engineer, R&D
- 2014–2015Manufacturing Process Technology Engineer, R&D
Education
M.S. Mechanical Engineering · B.S. Mechanical Engineering · B.S. Computer Science
University of Nevada, Las Vegas
Working tools: Python, PyTorch, TensorFlow, OpenCV, scikit-learn, ONNX, TensorRT; Databricks, Spark, MLflow, Azure; Allen-Bradley PLCs over OPC-UA, Ignition HMI, AVEVA MES; SolidWorks, COMSOL, MATLAB and Simulink. C/C++ and CUDA shipped in production earlier in his tenure; recent work is Python.
Notes. Patents, the conference paper and the plant groundbreaking are public record and linked where they appear. Production figures are company records, stated as the floor of any range. Proprietary detail is left out: no site codes, no process recipes, no code. Figures are simplified sketches, not to scale. Contact details are on the CV.